Highlights
In the business world, getting a handle on your invoice data isn’t just helpful; it’s necessary. An invoice analytics dashboard gives you the power to see exactly what’s happening with your money at a glance. This comprehensive overview breaks down how to create an effective dashboard, which numbers really matter, and how to use this information to make smarter decisions for your company.
Invoice analytics is simply the process of examining your invoicing data to find useful patterns and insights that can help your business perform better. By looking at this information systematically, companies can evaluate their cash flow, spot payment trends, and make their invoice processing more efficient. Using these data-driven insights helps businesses identify potential cash flow issues and improve their operations.
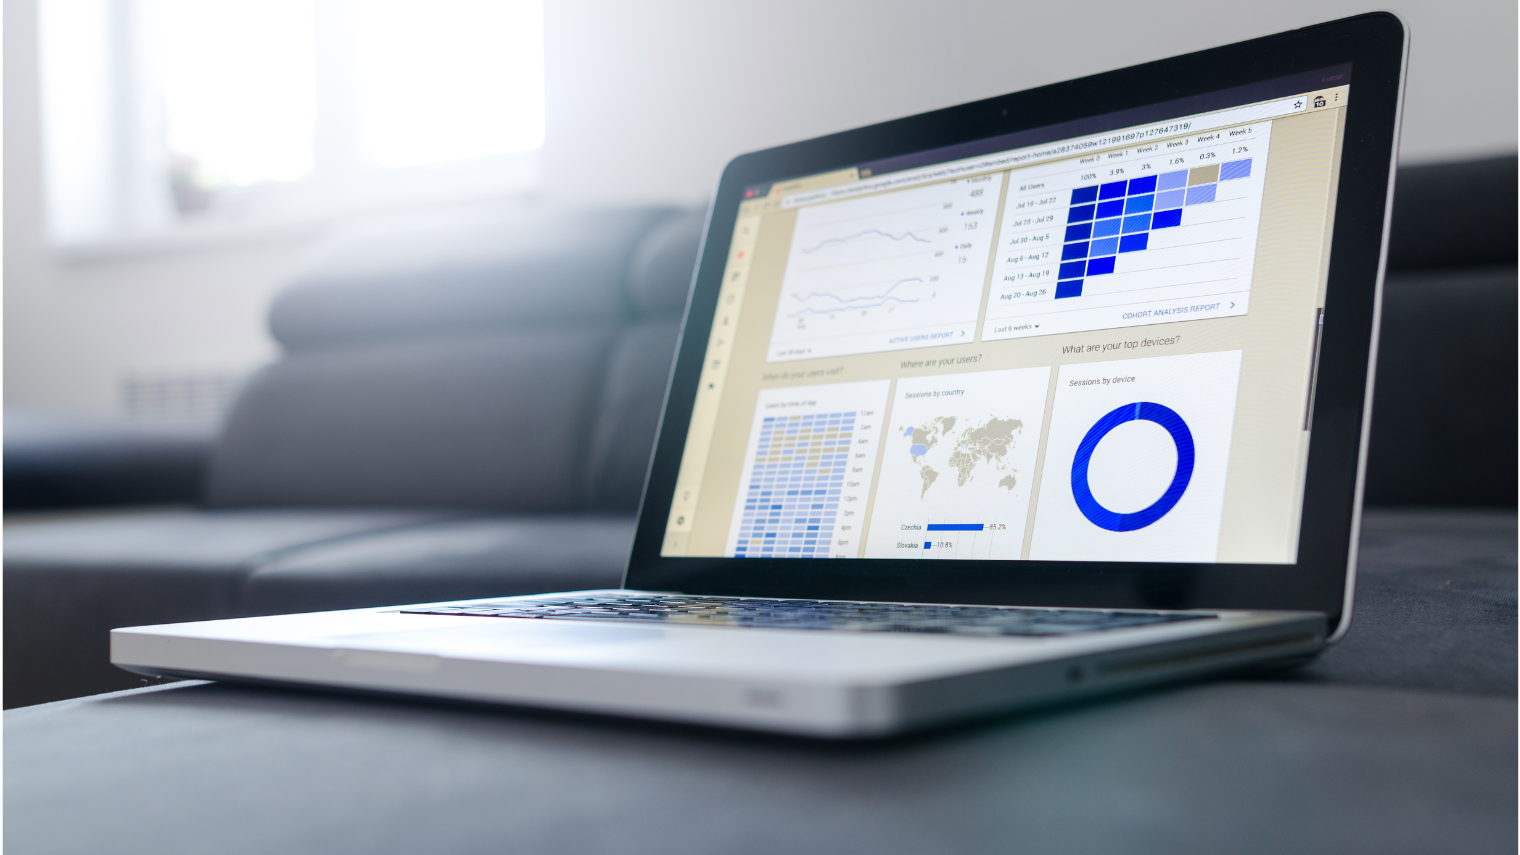
An invoice analytics dashboard visually presents your invoice data, giving you a quick summary of important metrics and trends. The advantages include:
Days Sales Outstanding (DSO) measures how long it typically takes to collect payment after making a sale. You can calculate it using this formula:
[ \text{DSO} = \left( \frac{\text{Accounts Receivable}}{\text{Total Credit Sales}} \right) \times \text{Number of Days} ]
A lower DSO means you’re collecting payments efficiently, while a higher number might signal potential cash flow problems.
Invoice aging reports are crucial tools that group unpaid invoices based on how long they’ve been outstanding, usually in 30, 60, 90, and 120-day categories. Keeping an eye on these reports helps businesses identify which customers consistently pay late and adjust their payment terms accordingly.
Looking at how well your payment terms work can show whether your clients respond well to them. By checking what percentage of invoices get paid within the agreed timeframe, you can figure out if you need to adjust your terms to encourage faster payments and reduce delayed payments.
This metric shows the average time from when you send an invoice until you receive payment. A shorter billing cycle improves your cash flow management, while a longer one might point to problems in your invoice processing.
The invoice correction rate tracks how often errors appear in your invoices, which can cause delays and upset customers. If you’re frequently correcting invoices, it might be time to review your invoicing procedures to find and fix the root causes.
Identifying patterns in payment delays can help you manage your cash flow more effectively. By analyzing which customers or invoice types tend to be paid late, you can develop strategies to address these delays and improve your collection process.
Looking at which payment methods work best can give you insights into what your customers prefer. Understanding which options lead to faster payments can help you streamline your invoice processing efficiency.
This ratio measures how effectively your company collects what it’s owed. A high turnover ratio shows that your collection processes are working well, while a low ratio might suggest you need to adjust your credit policies or collection efforts to address outstanding invoices.
Analyzing how customers have paid in the past can reveal payment trends that help you forecast future revenue. By understanding which customers consistently pay on time and which don’t, you can tailor your invoicing strategies to improve overall efficiency and reduce unpaid invoices.
Picking the right tools for your invoice analytics dashboard is crucial. Some popular options include:
When selecting a tool, look for features like easy software integration with your existing systems, a user-friendly design, and good reporting capabilities.
Understanding your dashboard data is key to gaining valuable insights. Look for trends over time, such as an increasing DSO or a growing percentage of overdue invoices. Spotting these patterns can help inform your strategic decisions and enable you to identify potential cash flow issues before they become problems.
Using insights from your invoices dashboard can lead to significant improvements in your invoicing practices. For example, if you notice a pattern of late payments from certain customers, you might decide to revise your credit policies or offer incentives for early payments to improve your accounts receivable process.
Real-world examples show the impact of effective invoice analytics. Many businesses have improved their profitability and operational efficiency by making changes based on what they learned from their comprehensive view of invoice data.
The Stripe Billing Analytics Dashboard provides an excellent example of how businesses can visualize payment trends and subscription metrics to gain insights into their revenue streams. With proper dashboard development, you can efficiently track your invoicing metrics and make more informed decisions directly from the dashboard.
This video walks through practical methods for reviewing and improving your invoice management systems using analytics to identify trends in your billing process.
What invoice metrics should I track?
Beyond DSO and invoice aging, you should consider tracking payment delays, billing cycle duration, and the invoice correction rate to get a complete picture of your invoicing performance and gain insights into your accounting processes.
How do I analyze my invoicing performance?
Use your dashboard to monitor key metrics and identify trends. Regular analysis will help you make informed adjustments to your invoicing strategies and enable you to spot issues with unpaid invoices quickly.
What are the most important billing KPIs?
The most crucial KPIs include DSO, invoice aging reports, and payment terms performance, as they provide insight into cash flow management and customer behavior. These metrics help you visualize your due date compliance and payment trends.
An invoice analytics dashboard is an incredibly valuable tool that can improve your business’s financial health. By tracking important metrics and analyzing your invoicing performance, you can make informed decisions that boost efficiency and profitability. Embracing data-driven insights isn’t just helpful, it’s necessary for staying competitive in today’s market.
To help you get started, consider downloading a free template for an invoice processing dashboard to streamline your processes. We’d love to hear about your experiences with invoice analytics in the comments below; your insights could help others handle their invoicing challenges more effectively.